
Industry Trends
How to use price and lead‑time data to anticipate strategic materials shortages

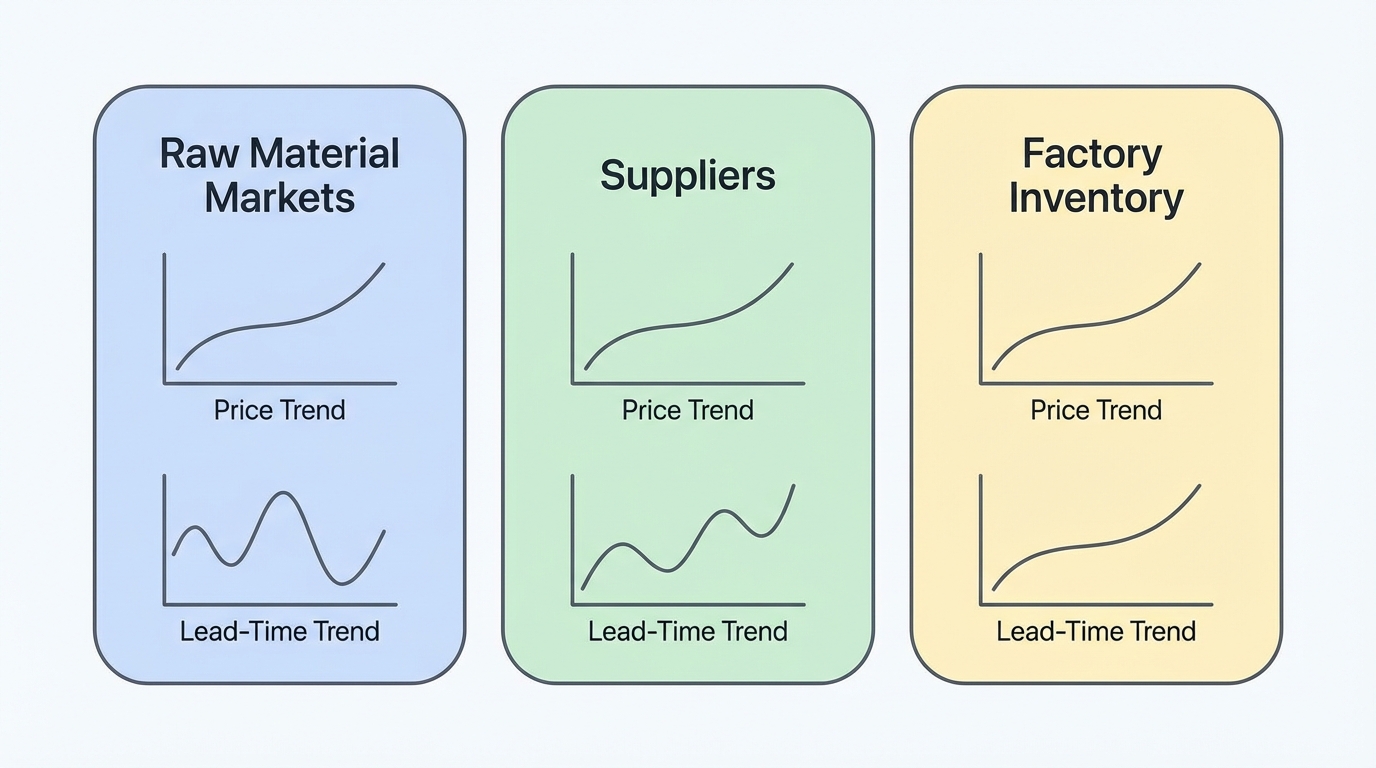
In strategic metals supply chains, the earliest signs of a shortage rarely appear in public price indices. They tend to emerge first in delivery promises, supplier behavior, and access to material. Only later do reference prices on venues such as LME or COMEX, or assessments from CRU Group, Fastmarkets, S&P Global, or MetalMiner, begin to fully reflect the imbalance. This guide sets out a practical framework for analysing how to use price and lead‑time data to anticipate strategic materials shortages, as observed in rare earths, platinum group metals, lithium compounds, titanium, tungsten, and related critical inputs.
- Lead-time inflation is typically the earliest quantitative signal of emerging tightness in strategic materials.
- Supplier behavior changes (allocation, MOQs, payment terms, buybacks) often precede or amplify lead-time shifts.
- Published prices and indices usually confirm, rather than initiate, shortage narratives.
- Combining lead-time, behavior, and price data into tiered alert levels clarifies internal risk communication.
1. Why Price-Only Monitoring Misses Early Shortage Signals
Strategic metals markets are only partially transparent. A portion of volume trades via visible benchmarks, but a significant share moves through long-term contracts, relationship-driven channels, and off-market deals. As a result, reference prices tend to be lagging indicators of stress.
In practice, availability constraints typically manifest through lead-time extension, access restrictions, and supply chain behavior changes before published prices adjust. Material may remain notionally “available” at index-linked prices, but:
- New spot enquiries receive longer delivery promises or are declined.
- Existing customers are given priority allocations while new accounts struggle to secure volume.
- Minimum order quantities (MOQs) increase as producers and traders ration scarce units.
- Suppliers tighten payment terms or request prepayments.
- Buyback activity of scrap or previously sold material accelerates.
These behaviors alter physical access long before headline indices move meaningfully. As one practitioner summary put it, “Lead time is the most reliable early warning signal because it reflects real supply-demand imbalance before price discovery occurs.” When lead times extend from 6 weeks to 12+ weeks in heavy rare earths, for example, this has often signalled constrained supply several weeks before published prices reflected the shortage.
2. Lead Time as the Primary Shortage Indicator
Lead time-order placement to material receipt-captures both upstream production constraints and midstream logistics congestion. Unlike prices, which reflect only transacted volumes visible to price reporters or exchanges, lead time reflects the full pipeline of confirmed and anticipated commitments.
In shortage analysis, a useful construct is lead‑time inflation: the ratio between current and baseline lead times for a given material-supplier pair.
Lead-time inflation factor = Current lead time / Baseline lead time
General observations from strategic metals programs:
- Lead-time extension of roughly 25-50% has been associated with emerging tightness, where material is still available but supply is clearly tightening.
- Extension in the range of 50-100% has typically coincided with significant shortages developing, often alongside first mentions of allocation.
- Extension exceeding 100% (for example, 6 weeks expanding to 12+ weeks) has usually indicated acute shortages or de facto unavailability.
These ranges are not universal rules; different materials exhibit different baseline volatilities. However, framing lead-time changes as inflation factors creates a consistent metric across suppliers and materials. In internal dashboards, teams frequently flag lead times exceeding the 75th percentile of historical observations and escalate once they cross the 90th percentile.
3. Supplier Behavior as a Qualitative Signal Layer
Lead-time data gains power when combined with qualitative observations from daily supplier interactions. In several disruptions, the most reliable early warnings came from changes in “how” suppliers communicated, not just “what” they quoted.

Behavioral signals frequently observed as supply tightens include:
- Allocation notices: explicit statements that volume will be rationed across customers; or implicit signals such as “can only offer X% of typical volume”.
- Rising MOQs: requirements to place larger orders per line item, effectively steering scarce tonnage toward larger or higher-priority accounts.
- Withdrawal of spot offers: traders and distributors declining to quote spot tonnage that was previously available, especially in REO, cobalt sulphate, or tungsten APT.
- Increased buyback interest: producers seeking scrap or offering to repurchase previously sold units, signaling a desire to consolidate material.
- Payment term tightening: shifts from open account to shorter terms or prepayment as suppliers manage credit and allocation risk.
- Reduced spec flexibility: unwillingness to support special grades, tolerances, or packaging formats that were previously accepted.
Capturing these signals systematically often requires nothing more complex than a structured supplier communication log. Typical fields include date, supplier, material, quoted lead time, any allocation or MOQ comments, and free-text notes about tone or urgency. When several suppliers begin exhibiting similar constraints simultaneously, the pattern often precedes visible price adjustment.
4. Price Data as Confirmation, Not the First Alarm
Price series from S&P Global, Fastmarkets, CRU Group, MetalMiner, and exchange data from LME or COMEX remain important, but in this framework they are treated as confirmatory signals. They help distinguish between temporary logistics noise and genuine structural tightening.
Observed patterns in strategic material shortages:
- Lead times begin to extend while prices remain comparatively stable; bid-ask spreads may start to widen.
- As supply tightness intensifies, published prices often register cumulative increases in the 5-10% range, associated in many internal frameworks with a medium-level alert.
- Further escalation, with price increases greater than 10% accompanied by acute lead-time inflation and allocation, corresponds to high-severity shortage conditions.
Monitoring bid-ask spreads and dispersion between different price sources (for example, Fastmarkets vs. CRU assessments, or off-index transaction reports vs. LME prices) often adds useful nuance. Widening spreads and inconsistent prints are typical during periods when participants are unsure where equilibrium lies, even before a new price level stabilizes.
5. Tiered Alert Framework Combining Lead Time and Price
Many organizations have formalized these observations into a tiered alert structure that combines lead-time, supplier behavior, and price movements. A typical framework is outlined below, framed as a descriptive model rather than a prescription.
Level 1 – Emerging Tightness
- Lead times drifting toward the 75th percentile of historical range.
- Isolated allocation hints from one or two suppliers.
- Price indices broadly stable, with mild upticks and slightly wider bid-ask spreads.
At this stage, internal teams often increase the frequency of supplier check-ins, refresh demand forecasts, and verify critical inventory positions, treating the situation as a “watch” condition.
Level 2 – Developing Shortage
- Lead times approaching or exceeding the 90th percentile of historical observations.
- Multiple suppliers signalling allocation, increased MOQs, or the withdrawal of spot offers.
- Published prices trending higher, with cumulative moves in the 5–10% range and higher volatility.
Under these conditions, observed organizational responses often include increased focus on alternative suppliers, cross-functional S&OP reviews, and scenario planning for constrained supply.

Level 3 – Acute Shortage
- Lead times doubling versus baseline, or explicit statements that material is unavailable for new orders.
- Allocation communicated formally; even long-standing accounts face caps.
- Published prices rising by more than 10%, with frequent off-index transactions at significant premia.
In this phase, organizations commonly transition to allocation management toward their own customers, activation of secondary sources (including scrap or substitutes where technically feasible), and high-level governance involvement.
6. Integrating Lead-Time Inflation into Planning Analytics
Once measured, lead-time inflation can feed directly into planning models. Rather than treating lead time as a static parameter, some S&OP teams maintain both a baseline and a current value, using the inflation factor as a multiplier in internal safety-stock calculations.
A simple representation often used in practice:
Adjusted safety stock = Baseline safety stock × Lead-time inflation factor
When lead time extends from, for example, 6 weeks to 12 weeks, the inflation factor of 2 would double the buffer quantity implied by a given demand forecast and service target. This does not automatically dictate an inventory decision, but it clarifies the magnitude of additional exposure if inventory policy remains unchanged.
Similarly, internal “reorder points” or planned order release dates can reference current, not baseline, lead times. Teams that adopt this practice often report fewer last-minute expedites when markets tighten, because the math itself embeds early warning information that would otherwise sit in disconnected emails or informal supplier comments.
7. Supplier Segmentation by Lead-Time Risk
Lead-time monitoring also reveals structural differences between supplier types. A common segmentation observed in strategic metals sourcing is:
- Integrated producers: Mining-to-refining chains or vertically integrated refiners often provide the most stable baseline lead times and predictable allocation behavior, though typically at larger contractual volume commitments.
- Major traders and distributors: These entities bridge multiple producers and customers, offering flexible packaging and volumes. Their lead times depend heavily on inventory strategy and can either buffer or amplify upstream disruptions.
- Spot-focused traders: Highly responsive to short-term supply-demand shifts; lead times and availability are volatile, but these channels sometimes provide the last pockets of material in acute shortages.
By tracking lead-time inflation by supplier tier and geography, risk teams gain visibility into where structural resilience actually resides. For instance, if integrated producers in multiple jurisdictions maintain stable lead times while spot traders experience sharp inflation, the signal differs from a scenario where integrated producers themselves begin extending lead times in unison.
8. Case Pattern: Lead Time Leading Price in Rare Earth Oxides
During a recent tightening episode in heavy rare earth oxides, internal monitoring at several manufacturers showed a consistent pattern:
- Chinese and non-Chinese refiners initially continued quoting at previously standard prices, but with lead times moving from around 6 weeks toward the 10–12 week range.
- Distributors began withdrawing spot offers for specific dysprosium– and terbium-rich blends, citing “no free stock”.
- Allocation conversations followed, with existing long-term customers receiving volume while new enquiries were declined or redirected to later quarters.
- Only after these physical signals had been evident for several weeks did published rare earth oxide assessments from price reporting agencies register sustained upward moves.
From an analytical standpoint, this episode illustrated the central principle of this framework: price series alone would have identified the shortage later than a combined view of lead-time inflation, supplier behavior, and emerging allocation language.
9. Operationalizing the Monitoring Workflow
In practice, the most robust early-warning systems for strategic materials combine several elements into a repeatable workflow:
- Data sources:
- Internal: ERP lead-time history, purchase order confirmations, supplier emails, S&OP meeting notes.
- External: Benchmark and assessment feeds from CRU Group, Fastmarkets, S&P Global, MetalMiner, and exchange data from LME and COMEX.
- Cadence: Many organizations integrate supply-risk reviews into their regular S&OP cycle, with more frequent checks during known stress periods such as major maintenance seasons or geopolitical inflection points.
- Structured logs: Centralized records of supplier quotes and qualitative comments, often maintained in shared spreadsheets or procurement systems, prevent early warnings from being trapped in individual inboxes.
- Automated alerts: Simple rules-such as notifying category managers when lead time for a given material exceeds its historical 75th or 90th percentile, or when cumulative price movement crosses pre-set thresholds—are frequently used to trigger deeper review.
Over time, these practices tend to create an institutional memory of how specific materials behaved during past disruptions. That history, in turn, improves interpretation of future signals: whether a sudden two-week extension is just a seasonal blip, or the first sign of a broader structural problem.
10. Summary: Complementary Roles of Lead-Time and Price Data
Experience across multiple strategic materials points to a consistent hierarchy of signals. Lead time, supplier allocation behavior, and qualitative access conditions typically signal tightness first. Published prices, indices, and benchmark assessments provide confirmation and magnitude, but on a lag.
Analytical frameworks that treat lead-time inflation as a core risk metric, capture supplier behavior systematically, and then overlay price developments from sources such as CRU Group, Fastmarkets, S&P Global, LME, COMEX, and MetalMiner, tend to surface shortages earlier and in a more structured way. That, in turn, supports more deliberate internal decision-making on buffers, substitutions, and customer allocation when disruptions inevitably arise.


