
Sentiment Analysis
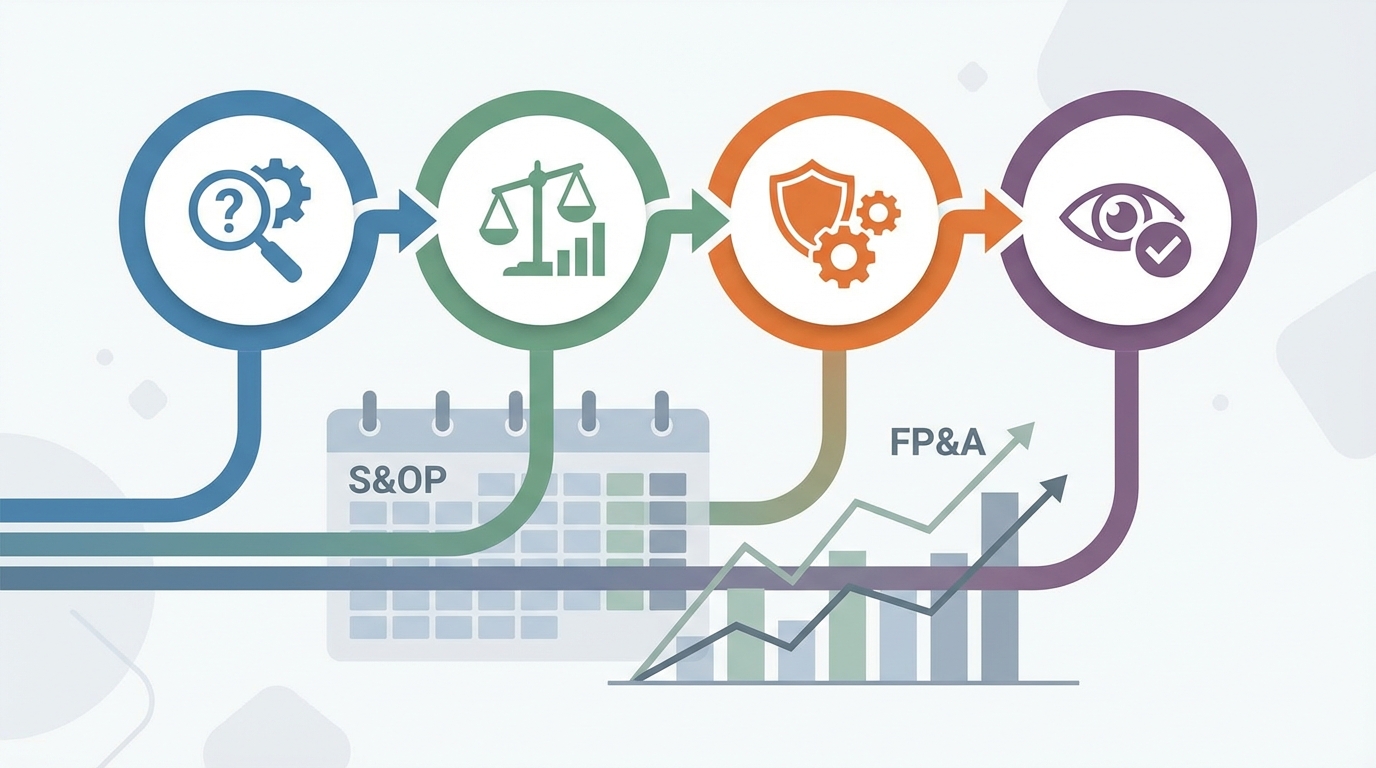
How to integrate strategic materials risk into s&op and fp&a

In electronics, battery, aerospace, and automotive programs, strategic materials such as rare earth elements (REEs), lithium, cobalt, and platinum group metals (PGMs) now drive production feasibility as much as demand. Material shortages have already triggered 20-50% cost spikes in several segments, while the International Energy Agency (IEA) projects a significant cobalt deficit by 2025 and notes that China supplies around 60% of global dysprosium for magnets. Many planning teams have responded by integrating these risks directly into Sales & Operations Planning (S&OP) and Financial Planning & Analysis (FP&A) cycles.
The following framework describes how organisations are operationalising that integration, what has worked in practice, and where failure modes tend to appear.
Operational Attention Points & Signals to Watch
- Key tradeoffs: Higher resilience (often cited at 15-25% disruption reduction) versus increased inventory holding (commonly 5-10% higher) and longer qualification timelines for alternative sources.
- Critical risks: Hidden Tier‑2/3 dependencies, concentration of supply in a single jurisdiction, and over-reliance on a small number of refineries or separation plants.
- Failure modes: Static “once-a-year” risk registers, S&OP and FP&A using different assumptions, and mitigation plans not tested against actual disruption scenarios.
- Indicators to watch: New export controls or quotas on REEs and battery metals, changes to critical minerals lists (U.S., EU, Japan), major mine or refinery incidents, and revisions to IEA/USGS outlooks.
- Governance signals: Existence of a cross-functional risk board, joint KPIs across supply chain and finance, and automated external data feeds rather than manual tracking.
1. Map Strategic Materials Exposure Across the Value Chain
Integration typically starts when planners discover that a disruption does not originate at a Tier‑1 supplier, but several layers upstream. A common example has been neodymium or dysprosium shortages that surfaced as delivery delays at a magnet fabricator, only later traced back to a constrained separation plant in China or to policy moves affecting concentrates.
1.1 Identify High-Impact Materials in the Portfolio
Teams usually classify “strategic” materials based on a mix of technical and supply criteria:
- Function-critical role: Materials whose absence halts assembly or dramatically degrades performance, such as NdFeB magnets in EV drive motors, cobalt in high-nickel cathodes, or PGMs in aerospace turbines and autocatalysts.
- Limited substitution: Where redesign to another chemistry or alloy would be complex, heavily regulated, or multi-year in validation (e.g., palladium to platinum substitution in catalysts, or LFP vs NMC in battery packs).
- Concentrated supply base: Exposure to materials dominated by a few mining regions or processors. Examples often cited include REEs concentrated in China, cobalt in the Democratic Republic of Congo, and certain PGMs in Southern Africa and Russia.
- High demand-growth pressure: Metals flagged by IEA and others as facing structural deficits, such as cobalt (with a projected deficit of around 30% mid-decade) and select REEs.
The output is usually a shortlist of strategic materials per business line, tagged to specific products, platforms, and revenue streams.
1.2 Trace Tiered Supply and Logistics Paths
Once priority materials are known, organisations extend the classic S&OP bill-of-materials view upstream:
- Link finished products to subcomponents (e.g., motors, catalysts, chips).
- Map those subcomponents to critical materials (NdPr, Dy, Li, Co, PGMs, high-purity alumina, etc.).
- Identify Tier‑1 and, where feasible, Tier‑2/3 suppliers, including mining and refining locations.
- Overlay transport corridors, ports, and choke points.
In practice, teams sourcing magnets from non-Chinese suppliers such as Lynas Rare Earths or MP Materials have often discovered that while oxide supply was diversified, downstream alloying or magnetising still depended on facilities in China. Similar patterns appear in lithium chains involving Australian miners like Pilbara Minerals or Albemarle, with conversion and cell production tied into Chinese or other Asian hubs.
1.3 Typical Failure Modes in Exposure Mapping
Several recurring issues have appeared across programmes:
- Incomplete Tier‑2/3 visibility: Suppliers report country of origin as the smelter location rather than the mine, masking sanctions or conflict-region exposure.
- Static documentation: Supply chain maps built as one-off projects, not incorporated into S&OP master data and so outdated within months.
- Disconnected compliance: ESG or conflict-mineral reports collected for audits, but not linked into planning models that drive sourcing and capacity decisions.
Programmes that have embedded this mapping into master data, compliance workflows, and supplier portals generally report fewer surprises when disruptions occur.
2. Bring Strategic Materials Risk into the Monthly S&OP Cycle
Once exposure is visible, the next step observed in practice is tagging material risk directly onto demand and supply plans. The aim is not to create a parallel “risk process” but to let S&OP scenarios reflect which volumes are structurally fragile.

2.1 Risk-Tagged Demand and Supply Plans
S&OP teams increasingly add strategic-material attributes to product families and supply nodes:
- Demand side: Forecasts for EV models, data-centre hardware, or aero engines carry tags for their reliance on lithium, Ni-rich chemistries, REEs, or PGMs.
- Supply side: Supply plans distinguish volumes coming from higher-risk jurisdictions or single points of failure, such as one refinery or one separation plant.
- Risk metrics: Each material-route combination carries scores for likelihood, impact, and velocity (speed at which disruption translates into lost production).
During monthly S&OP meetings, planners can then highlight, for example, that the next quarter’s magnet demand for a new e‑axle programme is 80% exposed to dysprosium sourced from a single country that already supplies around 60% of global Dy used in magnets.
2.2 Scenario-Based Balancing of Demand and Supply
Rather than a single “constrained plan,” many organisations now run multiple S&OP scenarios incorporating strategic materials risk:
- Base case: Assumes current supply portfolios hold, with moderate disruption probabilities.
- Adverse case: Reflects downside events such as export restrictions on specific REEs, energy rationing in refining hubs, or enforcement shifts in the U.S. Inflation Reduction Act (IRA) and EU critical raw materials regulations.
- Substitution/reallocation case: Tests whether production can shift to chemistries or product mixes that rely less on constrained materials (e.g., LFP-heavy mix for batteries, different PGM loadings in catalysts).
In one aerospace example, planners discovered during scenario runs that a relatively small increase in PGMs safety stock dramatically reduced the risk of grounded aircraft, whereas diversifying to an additional supplier would have taken years of qualification. That kind of insight rarely emerges without explicit risk-tagged S&OP simulations.
3. Translate Material Risk into FP&A Models
Embedding risk in S&OP creates operational visibility, but finance teams still require a way to translate it into budgets, cash-flow forecasts, and project economics. This is where probability-impact scoring, Monte Carlo simulations, and risk-adjusted scenarios enter FP&A routines.
3.1 Probability-Impact Scoring and Monte Carlo Simulation
FP&A teams commonly maintain a register of strategic materials with estimated disruption probabilities and financial impacts. Typical inputs include:
- Supply deficits and demand growth: For cobalt, analysts frequently refer to IEA forecasts signalling a deficit of around 30% mid-decade under certain scenarios.
- Price and basis-risk volatility: Historical volatility during past disruptions, such as PGMs spikes linked to labour unrest or sanctions.
- Volume-at-risk: Percentage of annual output exposed to high-risk jurisdictions or single-source refiners, derived from S&OP exposure mapping.
These parameters feed into Monte Carlo runs or discrete downside scenarios. The output is a distribution of potential margin, EBITDA, or cash-flow outcomes rather than a single forecast. Some organisations then calculate risk-adjusted net present values for major projects (for example, new cell plants, magnet lines, or recycling capacity) by explicitly including the probability of material constraints.
3.2 Linking Risk Outputs Back to Planning Decisions
What distinguishes mature practices is not the sophistication of the model, but the way results are fed back into operational decisions:
- S&OP inputs: FP&A provides bands for “risk-adjusted available supply” by material, which S&OP uses when approving demand plans and allocations between customers or regions.
- Inventory strategy: Analysis often supports holding 3–6 months of safety stock for the highest-risk materials. One battery manufacturer quantified that holding an additional 1,000 MT of NdPr equivalent, at an illustrative $80/kg, implied roughly $50M of working capital.
- Capital allocation: Risk-adjusted scenarios highlight where nearshoring, diversification, or recycling could change the distribution of outcomes, supporting board-level discussions.
For example, several OEMs have modelled the impact of incorporating more recycled material through partners such as Li‑Cycle or PGM recyclers like Heraeus, observing that even modest secondary feedstock shares can materially reduce downside tails in the distribution.
4. Align Mitigations Across Procurement, S&OP, and FP&A
Mitigation levers-diversification, nearshoring, buffers, design changes, and recycling-only reduce risk when they are consistently reflected in both operational and financial plans. Fragmented responses are a frequent cause of disappointment.
4.1 Diversification and Nearshoring Tradeoffs
Procurement-led initiatives have included:
- Geographic diversification of lithium supply across Australian and South American sources, with processing partly shifted to North America or Europe.
- Alternative REE chains using miners and separators like Lynas and MP Materials to reduce reliance on a single country, even when some magnet manufacturing still sits in East Asia.
- Mixed PGM sourcing between South African producers such as Sibanye-Stillwater and Russian entities like Nornickel, sometimes complemented by higher recycling intake.
FP&A teams usually model these strategies as portfolios of supply routes, each with distinct disruption probabilities, compliance profiles (e.g., IRA-eligible, EU-critical compliant), and working-capital implications. S&OP then incorporates these portfolios when approving allocation and capacity plans.
4.2 Buffers, Substitution, and Recycling
Other levers are more operational but still have strong financial effects:
- Tiered safety stocks: Higher buffers for the riskiest REEs and PGMs, lower for more diversified metals, with inventory levels reviewed quarterly as risk scores evolve.
- Design and substitution roadmaps: For instance, some EV programmes maintain optionality between nickel-rich and LFP chemistries, while catalyst makers work on PGM thrift or rebalancing between platinum and palladium.
- Recycling integration: Firms such as Li‑Cycle in batteries or Heraeus in PGMs feature as strategic partners in S&OP and FP&A plans, providing a secondary stream that is less exposed to primary mining disruptions.
In one consumer electronics example, alignment between procurement, S&OP, and FP&A enabled a major OEM, similar to Apple, to accelerate the use of recycled REEs in speakers and haptics. The result, as reported internally, was not only reduced primary dysprosium exposure but also smoother quarterly planning, since recycled inputs proved less correlated with geopolitical shocks.
5. Governance, Data, and Automation
Early integration attempts often faltered because they relied on ad hoc heroics or one-off analysis projects. More stable approaches share three elements: governance, consistent metrics, and automated data feeds.

5.1 Cross-Functional Risk Board and Joint KPIs
Organisations that have institutionalised this work typically operate a cross-functional risk board bringing together S&OP, FP&A, procurement, engineering, and sustainability. The board reviews a concise set of joint indicators, such as:
- Material-related disruption downtime as a percentage of total production time (with many aiming to keep this below low single digits).
- Variance of material-related spend against planned ranges (often targeted within a 10% band, depending on volatility).
- Share of volume sourced from high-concentration jurisdictions for each strategic material.
- Share of recycled or secondary material in total supply for relevant metals.
These metrics keep discussions anchored in system-level outcomes rather than siloed cost or availability concerns.
5.2 External Data Feeds and Early-Warning Indicators
Another discovery in many programmes has been the importance of data timeliness. Annual reports from USGS or IEA provide strategic context, but disruptions in REEs, cobalt, or PGMs often unfold over weeks or days.
- Automated feeds: Some firms have connected planning dashboards to structured data from USGS, IEA, customs statistics, and curated news wires, feeding into risk scores almost in real time.
- Event triggers: S&OP and FP&A models often include triggers for re-running scenarios when major events occur-new export controls, sanctions, mine accidents, or abrupt shipping bottlenecks.
- Vendor intelligence: Larger OEMs maintain structured dialogues with key suppliers such as Albemarle, Ganfeng, Lithium Americas, Lynas, Sibanye-Stillwater, and specialist recyclers, integrating qualitative forward views into planning cycles.
Experience from 2020–2024 suggests that organisations with this kind of monitoring in place tended to re-plan earlier during shocks, accepting temporary working-capital increases in exchange for reduced lost-volume risk.
6. Summary of Observed Outcomes and Open Questions
Across battery, aerospace, and advanced manufacturing sectors, integrated approaches to strategic materials risk have produced a few consistent patterns:
- Embedding material risk identification into monthly S&OP cycles, rather than treating it as a separate “risk project,” has made production and allocation decisions more realistic and defensible.
- Translating exposure into FP&A models using probability-impact scoring and Monte Carlo simulation has clarified the financial stakes of choices such as diversification, nearshoring, and recycling investments.
- Coordinated mitigations—diversified sourcing, tiered safety stocks, design options, and secondary feedstock—have tended to deliver resilience gains often cited in the 15–25% range, albeit with 5–10% higher inventory holding and some delay from qualification and compliance work.
- Governance via a cross-functional risk board, with a limited set of shared KPIs and automated external data feeds, has helped avoid siloed reactions and stale risk assessments.
Open questions remain around how aggressively to pursue nearshoring when local capacity is still immature, how to balance long-term offtake-like commitments with flexibility, and how quickly recycling technologies can scale in REEs, lithium, and PGMs. Nonetheless, integrating strategic materials risk into S&OP and FP&A has shifted the discussion from reactive firefighting toward structured tradeoff management between resilience, working capital, and compliance in an increasingly constrained materials landscape.


