
Sentiment Analysis
Why oem boards need a dedicated materials risk dashboard

Why OEM Boards Need a Dedicated Materials Risk Dashboard: The Governance Imperative
Materials Dispatch treats materials risk dashboards as governance infrastructure, not analytics decoration. Strategic metals supply shocks in the last decade have repeatedly shredded production plans, forced emergency redesigns, and raised hard questions in boardrooms about who actually had line of sight on critical inputs. The conclusion from multiple procurement cycles and post‑mortem reviews is blunt: without a dedicated materials risk dashboard, board oversight of strategic metals is largely aspirational.
Executive Highlights
- The change: Governance regimes (SEC disclosure, EU CSRD, upcoming critical minerals reporting) increasingly treat supply‑chain resilience for strategic metals as a board‑level responsibility, while market volatility in 2024-2025 has exposed gaps in existing tools.
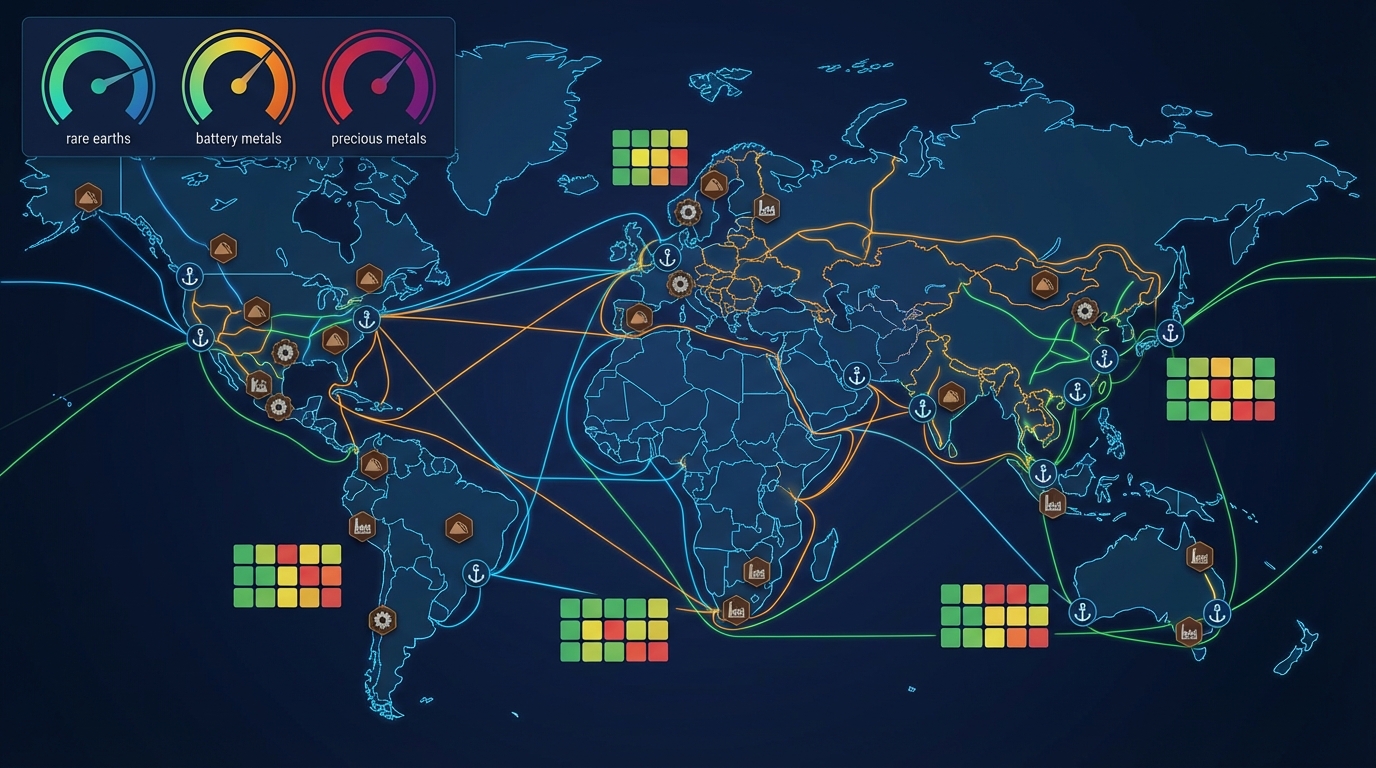
- Scope: Rare earths, battery metals (lithium, cobalt, nickel), and precious/PGM metals remain heavily concentrated in a few jurisdictions and assets, with China controlling an estimated ~90% of NdPr magnet capacity and analyses projecting material deficits for both NdPr and lithium by 2025.
- Coverage gap: Most OEMs operate with fragmented spreadsheets and static risk dashboards that overlook material‑specific exposure, leaving boards blind to early indicators of export controls, mine outages, or sanctions affecting strategic metals.
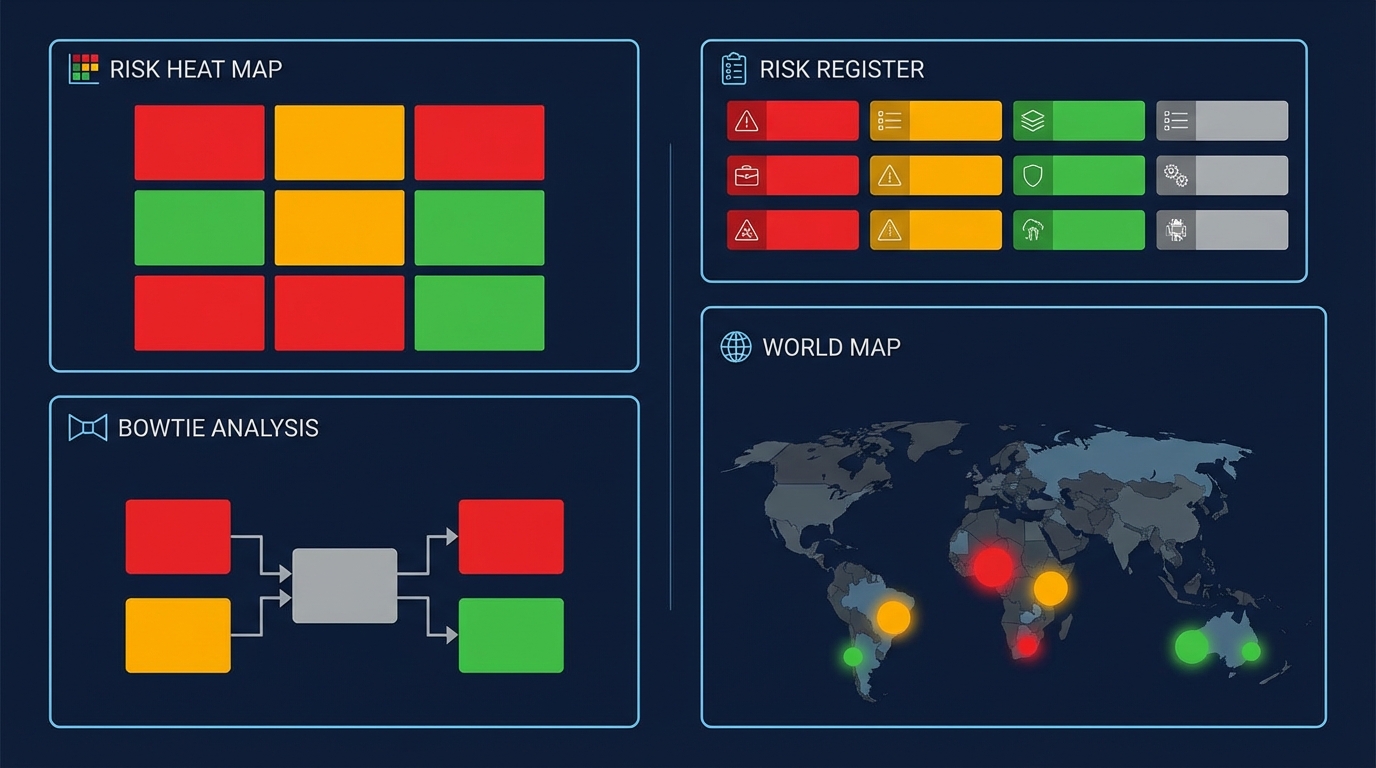
- Operational translation: A dedicated materials risk dashboard would typically combine heat maps for 15-20 critical materials, a structured risk register per material, and bow‑tie style causal maps from mine to end‑use component, anchored in ERP/BOM and external data.
- Limits: Dashboards do not remove geopolitical or geological risk; their value depends on data quality, board engagement, and integration into decision frameworks. They are a governance instrument, not an automatic hedge.
Context: Why Materials Dispatch Focuses on Dashboards Now
Over the last ten years, Materials Dispatch has watched three patterns repeat across automotive, aerospace, defense, and electronics OEMs:
- First, boards approve multi‑billion platform bets premised on secure access to a handful of strategic metals, often without a consolidated view of how exposed those metals are to single assets, single jurisdictions, or regulatory choke points.
- Second, when disruption hits-whether from Chinese export policy, South African power failures, or instability in the Democratic Republic of Congo-the board’s materials briefing typically arrives late, via a patchwork of procurement, engineering, and sustainability slide decks.
- Third, quantification of exposure is weak: risk is framed in narrative terms (“high dependence on China”) rather than in clear metrics (share of NdFeB magnet demand tied to Chinese separation capacity; percentage of cathode demand reliant on cobalt refined in high‑risk jurisdictions).
Materials Dispatch has seen entire procurement budgets redirected in a single quarter after a strategic metals surprise, with board members candidly admitting they had not appreciated how concentrated key inputs were. That is the governance gap a dedicated materials risk dashboard is meant to narrow.
FACTS: Governance Frameworks and Strategic Metals Market Structure
This section isolates factual elements: regulatory mechanics, the concentration profile of key materials, and documented disruption patterns.
Governance and disclosure expectations
Several regulatory and quasi‑regulatory frameworks have raised the bar for board‑level oversight of supply‑chain risk:
- U.S. securities disclosure: SEC disclosure rules require listed companies to report material risks and events that could affect financial condition or operations. For OEMs, substantial disruptions in supply of critical inputs can become disclosure events when they affect production, contracts, or revenue.
- EU Corporate Sustainability Reporting Directive (CSRD): CSRD mandates extensive reporting on sustainability‑related risks and impacts, including those stemming from the value chain. For materials, this encompasses environmental and human‑rights risks in mining and refining, as well as resilience of supply.
- EU Battery Regulation: The EU Battery Regulation introduces “battery passports” and due‑diligence obligations on raw materials used in batteries, requiring traceability and risk assessment along the chain, explicitly linking governance to lithium, cobalt, nickel, and related inputs.
- Critical mineral reporting initiatives: U.S. agencies, including the Department of Energy and others, have advanced critical minerals lists and reporting frameworks. While corporate reporting obligations are still evolving, the direction of travel is toward more granular visibility on critical input sourcing.
- Supply chain risk standards: Standards such as NIST SP 800‑161r1, although framed around cybersecurity and ICT supply chains, codify the expectation that boards and executives oversee systemic supply‑chain risks using structured processes and metrics.
None of these frameworks explicitly prescribes a “materials risk dashboard.” They do, however, collectively define an expectation: critical supply‑chain risks are board business, not a background operational detail.
Concentration in strategic metals
For the metals most relevant to EVs, clean energy, aerospace, and defense, supply is structurally concentrated:
- Rare earth elements (REEs), especially NdPr: Industry analyses prior to 2024 from firms such as Adamas Intelligence and Wood Mackenzie estimated that China controlled on the order of 90% of global production of neodymium‑praseodymium (NdPr) used in permanent magnets, after accounting for both mining and separation capacity. Non‑Chinese supply is anchored by MP Materials’ Mountain Pass operation in the U.S. and Lynas Rare Earths’ Mt Weld operation in Australia, but these combined capacities remain well below Chinese levels.
- Projected NdPr deficit: The same analyses projected a global deficit of around 20,000 tonnes of NdPr‑equivalent by the mid‑2020s under then‑current demand trajectories, driven by EV traction motors, wind turbines, and high‑end industrial applications.
- Lithium: Benchmarking work by specialist consultancies ahead of 2024 suggested that lithium carbonate equivalent (LCE) demand was likely to exceed supply by approximately 200,000 tonnes around 2025 in base‑case EV adoption scenarios, even accounting for announced projects. Production is highly concentrated in Chilean brines (e.g., SQM in Salar de Atacama) and Australian hard‑rock mines, with conversion capacity heavily weighted toward China.
- Cobalt: More than half of mined cobalt originates in the Democratic Republic of Congo, with significant refining capacity situated in China. This creates a dual concentration: geographic and processing‑chain.
- PGMs (platinum, palladium, rhodium): Supply is dominated by South African and Russian producers. Norilsk Nickel in Russia and South African operations such as Amplats and Implats account for a large share of global PGM output, feeding autocatalysts and electronics.
These concentration patterns are not new, but board‑level tools to visualise and track them in relation to individual OEM exposure remain underdeveloped.
Recent regulatory and geopolitical shocks
Several episodes illustrate how policy or geopolitical moves in a single jurisdiction can ripple through strategic metals supply:
- Chinese export controls: China’s 2023 export licensing requirements for gallium and germanium, followed by expanded controls on certain graphite products, demonstrated the state’s willingness to use materials policy as a strategic instrument. Industry debates have since focused on whether rare earth magnets or other critical materials might be next.
- Antimony export curbs and price shock: In 2024, Chinese antimony export licensing and tighter controls were associated with a sharp spike in antimony prices. Market commentary described moves from roughly $12,000 per tonne to around $38,000 per tonne in a short window. This briefing does not address pricing strategies or contracting, but notes the episode as an indicator of volatility and concentration risk.
- Instability in antimony and cobalt supply regions: Security and political developments in Myanmar (antimony) and the DRC (cobalt) have led to intermittent production interruptions and uncertainty about future output, as reported by mining and commodity outlets.
- Energy and labour constraints in PGM hubs: South African mining operations have repeatedly faced power rationing and labour actions, affecting PGM production. Russian operations have grappled with sanctions risk and logistics constraints.
These are not abstract “macro” developments; they map directly onto OEM bill of materials and platform roadmaps when the metals involved sit in magnets, cathodes, catalysts, or high‑reliability electronics.

State of materials risk information inside OEMs
Across automotive, aerospace, and electronics OEMs observed by Materials Dispatch, several common information patterns emerge:
- Critical materials dependencies often sit deep in multi‑tier supply chains (e.g., rare earth magnets in outsourced drive units; PGM coatings in purchased chips), with limited traceability beyond the first tier.
- Enterprise risk dashboards focus heavily on financial, cyber, and compliance risks; materials risk appears, if at all, as a qualitative entry (“raw material volatility”) without material‑specific metrics.
- Procurement teams may track key commodity trends, but typically on spreadsheets or vendor systems that are not integrated into board reporting packs.
- Incident reporting (strikes, environmental shutdowns, export restrictions) is monitored by individual teams or regional offices, rarely fused into a single view of “strategic metals risk” across the portfolio.
That is the factual baseline against which the dashboard discussion takes place.
INTERPRETATION: Why a Dedicated Materials Risk Dashboard Changes Board Governance
This section sets out a reading of those facts: what a materials risk dashboard would do, why boards of OEMs increasingly gravitate toward such tools, and where the limits lie. The reasoning is conditional and does not constitute prescriptive guidance.
From diffuse data to fiduciary accountability
If board members carry explicit responsibility for overseeing supply‑chain risks that can halt production or derail strategic programs, relying on scattered spreadsheets and ad‑hoc briefings looks increasingly hard to defend. In that light, a dedicated materials risk dashboard functions less as an analytical “nice to have” and more as the basic instrumentation for discharging fiduciary duty on a high‑risk domain.
Several directors and risk officers interviewed by Materials Dispatch over recent years have converged on similar language: without a structured, continuously updated view of exposure to strategic metals, board discussions around electrification, autonomous systems, or defense platforms risk operating on partial information. Some have gone as far as to call such dashboards “non‑negotiable for strategic criticality.” That is not a legal standard, but it is a revealing sentiment from those in the governance hot seat.
What a board‑level materials risk dashboard would typically contain
Based on existing enterprise risk dashboards and materials‑specific pilots reviewed by Materials Dispatch, a credible board‑facing materials dashboard would usually combine at least three elements:
- Critical materials heat map: A matrix of 15-20 materials (rare earths, lithium, nickel, cobalt, graphite, PGMs, titanium, tungsten, high‑purity alumina, etc.) scored on dimensions such as supply concentration, geopolitical risk, substitution difficulty, and share of corporate revenue dependent on each material. For example, NdPr magnets for EV drivetrains and defense systems would likely sit in the highest‑criticality quadrant, given China’s ~90% share of NdPr capacity and limited near‑term substitution options.
- Risk register by material: For each high‑criticality material, a structured record of key assets (mines, refiners, processors), jurisdictions, and suppliers, with associated risk indicators. Indicators might include export control exposure, sanctions risk, environmental enforcement history, labour disruption frequency, and ESG controversies, without drifting into commercial pricing or contracting specifics.
- Bow‑tie style causal maps: Visuals that trace how threats (e.g., new Chinese export restrictions on rare earth magnets; power shortages in South African PGM operations; instability in DRC cobalt regions) could propagate through specific supply paths into OEM plants, Program A/B/C, and ultimately into delayed vehicle or aircraft deliveries.
In practice, these elements rely on integration between internal systems (ERP, purchasing, engineering BOMs, compliance reporting) and external datasets (USGS, customs data, specialist market and ESG intelligence). Boards that receive this as a standing item can interrogate exposure, challenge assumptions, and connect strategic decisions-such as platform launches or plant siting—to materials reality.
Case lens 1: Rare earth magnets and EV/defense exposure
Rare earth permanent magnets sit at the heart of EV traction motors, wind turbine generators, and many defense systems. With Chinese capacity dominating NdPr production and separation, and non‑Chinese supply limited to a small number of operations (notably MP Materials’ Mountain Pass and Lynas’ Mt Weld), the system exhibits clear single‑point‑of‑failure characteristics.
In Materials Dispatch’s reading, a proper materials dashboard would have flagged three signals early in the last cycle:
- Escalating discussion in Beijing and international media about tightening controls on strategic technologies and related materials, following the gallium, germanium, and graphite moves.
- Slow ramp‑up and permitting challenges at non‑Chinese REE projects, indicating that diversification was advancing but still fragile.
- Growing demand from EV, wind, and defense segments converging on the same NdFeB magnet supply base, pushing the projected NdPr deficit into view.
Boards seeing these signals in an integrated dashboard—overlaid with their own magnet suppliers, platform plans, and regional mix—would be positioned to ask harder questions about design choices (magnet vs. induction motors), regional sourcing balance, and contingency planning. The absence of such visibility has been visible in recent production slowdowns and re‑sourcing scrambles reported across the EV and defense landscape.
Case lens 2: Battery metals as a cross‑sector choke point
Lithium and cobalt have shifted from specialist chemicals to cross‑sector chokepoints. Automotive OEMs, stationary storage providers, consumer electronics companies, and defense actors increasingly compete for the same battery‑grade raw materials and processing capacity.
Analysts’ projections of a ~200,000 tonne LCE supply‑demand gap around 2025, combined with geographic concentration in Chilean brine fields, Australian spodumene mines, and Chinese converters, translate into a straightforward governance question: how exposed is each OEM’s product roadmap to a shortage or disruption at a handful of assets or ports?
Similarly, cobalt dependence on the DRC, with refining weighted toward China, introduces both ESG and geopolitical dimensions. The DRC has seen repeated reporting of artisanal mining encroachment, security incidents, and community‑company tensions. A board‑level materials dashboard that maps cobalt content from DRC mines through Chinese refiners into specific cathode and cell suppliers would make these linkages explicit, allowing directors to read ESG risk and physical supply risk in one frame.
Case lens 3: PGMs and electronics – hidden dependencies
Platinum group metals (PGMs) and gold are textbook “hidden” dependencies: small in unit volume, critical in function. Autocatalysts rely on platinum and palladium; many high‑reliability electronic components depend on PGM and gold plating for corrosion resistance and conductivity. South African operations and Russian producers like Nornickel dominate the supply base.
Energy shortages and labour disputes in South Africa, combined with evolving sanctions and logistics constraints affecting Russian metals, have repeatedly constrained PGM flows. Yet many OEM boards first encounter PGM supply as a line item under “cost headwinds” rather than as a structured resilience question: how many programs, in which regions, rely on PGMs from high‑risk sources, and what technical or sourcing alternatives exist?
A materials dashboard that connects PGM exposure to specific plants, programs, and suppliers could reframe those conversations from reactive margin management to forward‑looking resilience governance, particularly as emissions regulations and electrification trajectories reshape PGM demand patterns.
Implementation realities, trade‑offs, and failure modes
Experience with enterprise risk dashboards across sectors suggests several practical realities that also apply to materials dashboards:
- Data integration is the hard part: Extracting materials exposure from ERP and BOM systems, especially where multiple generations of IT coexist, is technically demanding. Multi‑tier supplier data is often incomplete. Without disciplined data governance, dashboards risk being visually impressive but analytically hollow.
- Board engagement determines value: Where boards treat the dashboard as a compliance artefact, it quickly degrades into a static slide in quarterly packs. Where directors actively interrogate scenarios—“What if China added rare earth magnets to its control list?”; “What if DRC exports fell sharply for a year?”—the tool becomes a genuine governance instrument.
- Risk of false comfort: Over‑precise scoring, especially where underlying data is thin, can create an illusion of control. Materials Dispatch has seen dashboards where criticality metrics imply fine‑grained precision that simply does not exist in upstream data.
- Trade‑offs visible, not resolved: Dashboards can illuminate the tension between concentration risk and commercial terms, or between ESG performance and supply security. They do not resolve those tensions. Boards remain responsible for explicit choices: accepting certain exposures, redesigning products, or re‑phasing programs.
In short, a dedicated materials risk dashboard can strengthen governance if it is grounded in realistic data, embedded into board routines, and recognised as an input into judgement rather than a substitute for it.
WHAT TO WATCH: Signals Around Materials Dashboards and Strategic Metals
Several weak and strong signals will indicate how far OEM governance is moving toward structured materials risk oversight:
- Regulatory moves on critical minerals reporting: Any tightening of national or regional reporting requirements for critical mineral sourcing, especially where explicitly linked to board accountability, would increase pressure for dashboard‑style tools.
- Expansion of export controls and sanctions: Additional Chinese export controls on strategic materials (for example, rare earth magnets or battery precursors), new sanctions affecting Russian or other producers, or tighter environmental/export regimes in producer countries will test which boards have pre‑modelled these scenarios.
- OEM disclosures referencing materials dashboards: References in 10‑K/20‑F filings, CSRD reports, or sustainability reports to “materials risk dashboards”, “critical materials heat maps”, or similar constructs would signal that boards are formalising this capability.
- Insurance and ratings scrutiny: If credit rating agencies or insurers begin to factor explicit critical‑materials governance into ratings or underwriting, the board‑level salience of dashboards will increase sharply.
- Procurement and engineering integration: Evidence that OEMs are embedding materials risk metrics into platform gate reviews, sourcing councils, and capex decisions would indicate that dashboards are not just reporting tools but operational inputs.
Conclusion
Strategic metals risk has moved from the margins of OEM governance into its centre. Concentrated supply, intensifying geopolitical use of materials policy, and tightening disclosure regimes collectively mean that board oversight of rare earths, battery metals, and PGMs now sits on the same plane as cyber, financial, and regulatory risk. In that setting, a dedicated materials risk dashboard is less a technology choice than a question of whether boards intend to see, in structured form, where the supply‑chain weak points actually are.
Dashboards will not avert export controls, mine accidents, or social conflict at remote sites. They can, however, expose where corporate strategy leans most heavily on such fragile foundations, and where mitigation options genuinely exist. Materials Dispatch will continue active monitoring of regulatory and industrial weak signals shaping how OEMs formalise materials risk dashboards in the coming years.
Note on Materials Dispatch methodology Materials Dispatch analyses strategic metals governance by cross‑referencing official texts and guidance from regulators and standard‑setters, specialised market reporting on supply disruptions and concentration, and the technical specifications of end‑use applications in automotive, aerospace, defense, and electronics. This triangulation is used to assess where regulatory language, market realities, and engineering constraints align or diverge in shaping materials risk dashboards for OEM boards.


